Data Apps
A data app is an account-level scorecard or form that you define once and fill in for every account, one reporting period at a time. Use one when a recurring review, such as a quarterly health scorecard, a success plan checkpoint, or an executive business review worksheet, needs numbers from your data, answers typed in by your team, and scores FunnelStory calculates from both, all kept in one place with a full change history and an official published version per period.
Data Apps are enabled per workspace by FunnelStory. If you don't see Configure → Data Apps or an account Data Apps tab, ask your FunnelStory contact to turn them on.
How data apps work
Each data app has a definition: the fields it tracks and the views that display them. FunnelStory applies that definition to each account and each reporting period (monthly by default, or daily, weekly, quarterly, or yearly).
- Fields hold values. A field's value can come from one of your datasets, from a semantic query, from a person typing it in, or from a calculation over other fields and parameters.
- Views are the tabs people see on the account. A view arranges fields, text, forms, images, and sections into a layout.
- Working draft: the current, editable state for an account and period. Refreshing sources or saving a form updates the draft.
- Published snapshot: the official, frozen version for a period. Publishing again replaces it. People can switch between the draft and the published snapshot at any time.
Every change, including a value typed in, a manual override, or a cleared override, is recorded, so you can see who changed what and when.
Creating and editing a data app
- Go to Configure → Data Apps.
- Click Create data app. FunnelStory creates a starter definition named New data app and opens it.
- Enter a Name and, optionally, a Description. The description appears above the view on each account.
- Edit the Config JSON (parameters, fields, and views). See The definition below.
- Click Save. Saving a changed config creates a new version of the definition.
From the Data Apps list, use Edit to change a definition, Share to create a link or embed (Sharing Data Apps), and Delete to remove one.
Deleting a data app also permanently removes every entry and published snapshot it holds for every account. The data can't be recovered.

The definition
The Config is a JSON object with these top-level keys:
| Key | Required | What it holds |
|---|---|---|
fields | Yes | The values the data app tracks. |
views | Yes | The tabs shown on the account, and their layouts. |
parameters | No | Named constants, such as targets or thresholds, that calculated fields can use. Each has an id, a type, and an optional default. |
field_groups | No | Named sections that fields can belong to. |
period | No | {"interval": "monthly"}. One of daily, weekly, monthly, quarterly, or yearly. Defaults to monthly. |
Fields
| Property | What it does |
|---|---|
id | Unique identifier. Used in layouts, forms, and calculations. |
type | The value's type, such as number, string, boolean, array, or object. |
source | Where the value comes from (see below). |
label | The short name shown on the field and its input. If you leave it out, FunnelStory uses the description, then a readable version of the id. |
description | A longer explanation, shown as secondary help under the label. |
placeholder | A format hint shown inside an empty input, such as Yes/No or #. |
group | The id of a field group, which puts the field in that collapsible section. Once a definition declares any field_groups, every group must match one of them. |
row | A shared measure name inside a group. Inputs with the same row are shown together as one row, for example one row per metric with a column per sub-period. |
Field sources:
source.type | Value comes from |
|---|---|
manual | A person, through a form or the Fields & Inputs panel. |
dataset | A record in one of your datasets. Requires dataset and key; field picks one column. |
semantic | A query against your workspace data. Requires query. |
expression | A calculation over other fields, parameters, and account data. Requires expression. |
script | A JavaScript calculation. Requires script. |
Fields are calculated in the order they're declared, so a calculated field can use any field listed above it. If one field fails to calculate, it's left empty and flagged, and the rest of the data app still resolves. A person can override a dataset or semantic value by hand; clearing the override brings back the source value.
Field groups
A field group turns related fields into a collapsible section in the Fields & Inputs panel, even for a data app that has no view.
| Property | What it does |
|---|---|
id | Referenced by a field's group. |
label | The section heading. |
description | Secondary help shown under the heading. |
collapsed | true starts the section closed. Sections are open by default. |
Views and layout
Each view has an id, a label (the tab title), access, and a layout. Set access to {"type": "workspace"} for views your team uses on the account page.
A layout is a list of nodes:
Node type | What it shows |
|---|---|
field | A field's value with its label. "variant": "headline" shows the value large, as the view's main answer. |
text | Static text (value) or a bound value (bind), with an optional format of number, percent, or string. |
form | Inputs for the listed inputs fields. "submit": "set" replaces values; "submit": "append" adds a new response each time. |
container | Holds other nodes (items) in a row, column, or grid (with columns), shown plain or as a card. |
repeat | Repeats a template for each item in a list field (collection, named by as). |
image | An image from src or a bound value. Requires alt. |
svg | Inline SVG, with field values filled in. |
Collapsible sections. Give a container a label and it becomes a collapsible section with that heading. Add "collapsed": true to start it closed. When a section contains a headline field, its heading also shows that value, for example Support health — 72.50, so a long scorecard can open short and still show each section's result.
Conditional layout. Any node can have an if that names a field, for example "if": "fields.has_open_p1s". The node only appears when that field's value is true or non-empty. The condition is always a field, not an inline expression, so to show something conditionally, add a calculated field that holds the condition. Because the condition is a field, it's frozen into the published snapshot along with everything else. Hiding a form doesn't lock its fields; it only affects what's displayed.
A few rules are checked when you save: a form can't edit a calculated field, the same field can't be written by both a set form and an append form, and every field or bind path a view references must exist.
Example
{
  "period": { "interval": "quarterly" },
  "parameters": [{ "id": "p1_target", "type": "number", "default": 2 }],
  "field_groups": [
    { "id": "support", "label": "Support health", "description": "Escalations this quarter", "collapsed": true }
  ],
  "fields": [
    {
      "id": "open_p1_tickets",
      "type": "number",
      "label": "Open P1 tickets",
      "placeholder": "#",
      "group": "support",
      "source": { "type": "manual" }
    },
    {
      "id": "support_score",
      "type": "number",
      "label": "Support score",
      "group": "support",
      "source": {
        "type": "expression",
        "expression": "fields.open_p1_tickets <= parameters.p1_target ? 100.0 : 50.0"
      }
    },
    {
      "id": "has_open_p1s",
      "type": "boolean",
      "source": { "type": "expression", "expression": "fields.open_p1_tickets > 0.0" }
    }
  ],
  "views": [
    {
      "id": "scorecard",
      "label": "Scorecard",
      "access": { "type": "workspace" },
      "layout": [
        {
          "type": "container",
          "label": "Support health",
          "items": [
            { "type": "field", "field": "support_score", "variant": "headline" },
            { "type": "field", "field": "open_p1_tickets" },
            { "type": "text", "value": "Open P1s need a follow-up plan.", "if": "fields.has_open_p1s" }
          ]
        },
        { "type": "form", "label": "Update support inputs", "submit": "set", "inputs": ["open_p1_tickets"] }
      ]
    }
  ]
}
Using a data app on an account
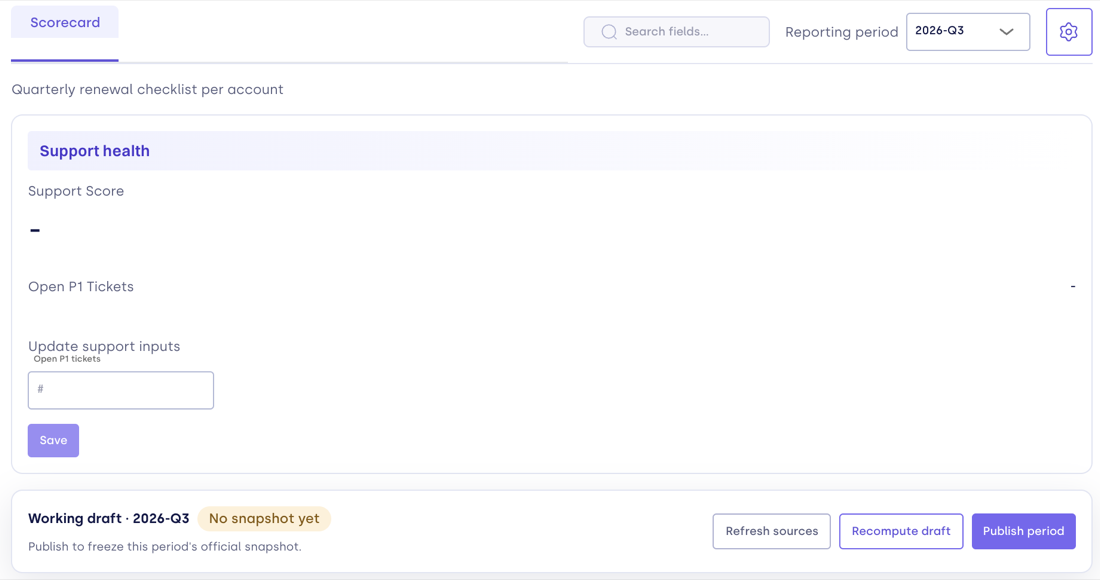
Open an account and go to its Data Apps tab. The toolbar lets you:
- Switch between the definition's views, one tab each.
- Pick a Data app, when your workspace has more than one.
- Pick a Reporting period. The current period is always available; a new period appears when the calendar reaches it.
- Pick a Version: Working draft or the period's published snapshot, once one exists. A published snapshot is read-only.
- Search, using Search fields….
- Open the settings menu for Fields & Inputs, History & Audit, and Copy embed URL (see Sharing Data Apps).
Filling in values
Fill in a view's forms and save. A set form updates the current values; an append form adds a new response each time you submit it.
The Fields & Inputs panel lists every field, grouped into its sections, with its current value, where it came from, and its source value. Fields that a form makes editable can be changed inline. Pending manual overrides are highlighted, and Clear removes an override so the source value applies again. Any field that failed to calculate is listed with its error at the top of the panel.
Refreshing and publishing
The action bar at the bottom of the tab shows whether the period has a published snapshot and offers three actions:
| Action | What it does |
|---|---|
| Refresh sources | Fetches dataset and semantic values again and recalculates the draft. |
| Recompute draft | Recalculates the draft from the values already fetched, without fetching again. |
| Publish period | Freezes the current draft as the period's official snapshot, replacing any earlier one. |
Refreshing is on demand. Values from your data don't update in a data app until someone clicks Refresh sources.
History & Audit
History & Audit lists every change for the selected period, with When, Actor, Kind, and Changes columns.
Searching
The search box filters whatever you're looking at: the current view, Fields & Inputs, or History & Audit. In a view, it matches field, text, form, and section labels, keeps whole grid rows (with their header row) so a matched metric keeps its score next to it, and opens any collapsed section that contains a match. Matching text is highlighted. In Fields & Inputs, it matches a field's id, label, description, and section heading, and shows how many fields matched (for example 3 of 24 fields). Hidden conditional content isn't searched.
How values are displayed
Whole numbers are shown as-is. Other numbers are rounded to two decimal places, for example 4.90 or 0.15, in fields, text, section headings, and SVG.
Related
- Sharing Data Apps: share a data app through a link or embed it in another tool.
- Data models: the data that dataset and semantic fields read from.