Step-through debugging
The Step through flow panel runs an agent one step at a time, like a code debugger. Instead of firing the whole graph and reading logs afterward, you pause before every step, inspect the exact variables that step will see, edit them if you need to, and then advance.
Use it to answer questions a log viewer can't: what does this step actually receive?, why did the loop take this branch?, what happens if this value were different?
- A step behaves differently than you expect and you want to see its inputs before it runs.
- You're debugging a loop and need to inspect each iteration's local values.
- You want to test a "what if" on a variable without re-authoring the flow — edit it live and continue.
Open the panel
Step-through lives in the agent builder's right-hand panel, next to the canvas. To open it, click the Trigger Event node to open the trigger panel, then choose Step through.
There are three ways a session begins:
| Entry point | What it does |
|---|---|
| Manual step-through | Choose Step through with no trigger payload. The run starts from the flow's inputs. |
| Trigger step-through | From the trigger preview, step through a specific matching row/event — that payload becomes $.trigger. |
| Resume | Reopen an unfinished session and pick up exactly where it left off. |
When the panel opens without an active session, it shows the session picker: start a new session, or resume an existing unfinished one.
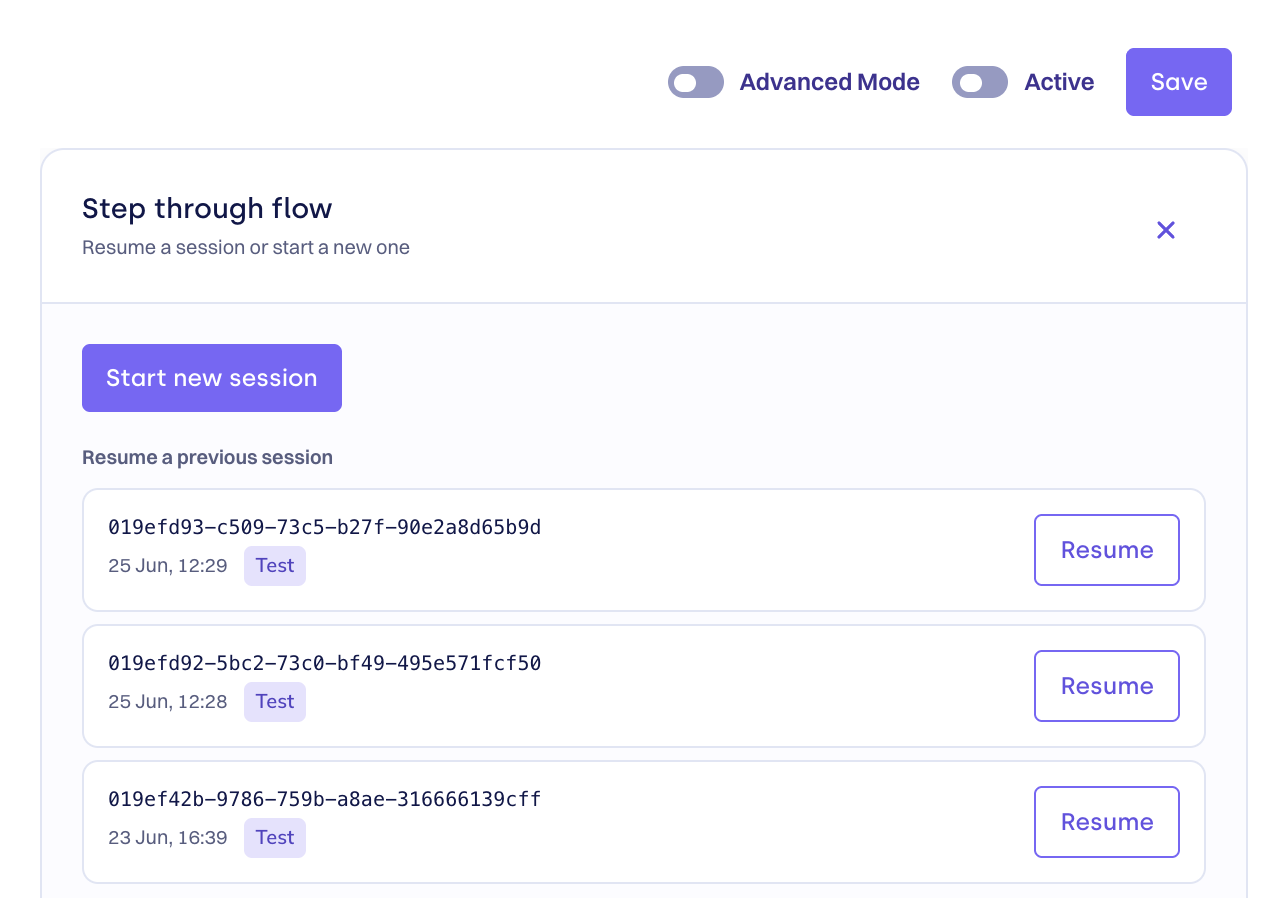
Each resumable session shows its run id, when it was created, and a Test badge if it was started in test mode. Click Resume to reopen it.
Start a new session
Starting a session opens the start screen, where you pick a mode and confirm inputs before the run is created (paused at the first step).
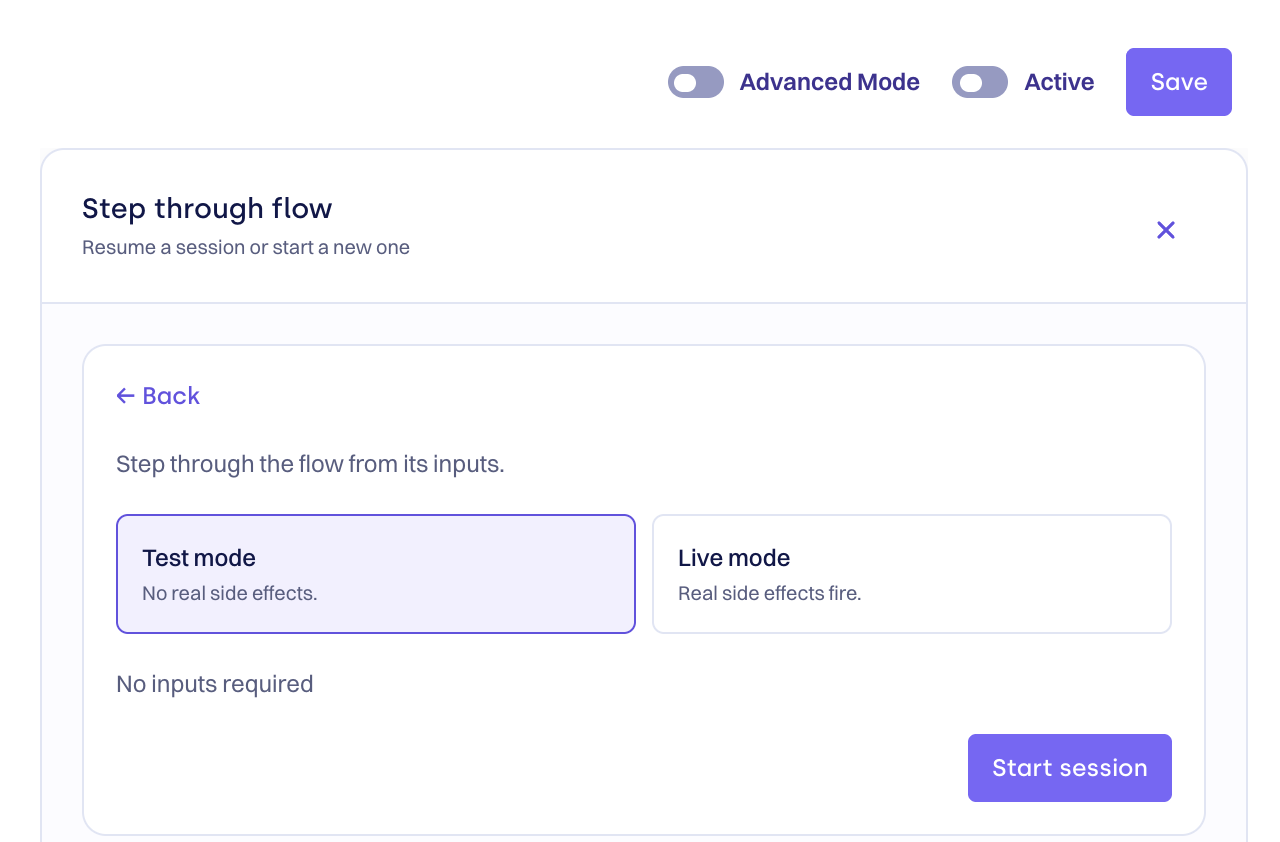
Test vs Live mode
| Mode | Behavior |
|---|---|
| Test mode (default) | The run executes but no real side effects fire — safe for experimenting. |
| Live mode | Real side effects fire (messages sent, records written). Use only when you intend production-like behavior. A warning banner appears while Live is selected. |
Inputs
If the flow declares inputs, the start screen renders them with their defaults pre-filled — edit them as needed to seed the run's starting variables. For a trigger step-through, the selected trigger payload is attached automatically; you don't enter it here. If the flow takes no inputs, you'll see No inputs required.
Click Start session (or Start live session) to create the paused run.
The in-session view
Once a session is active, the panel becomes the debugger. From top to bottom: the current step, the upcoming queue, global variables, and the per-step scope.
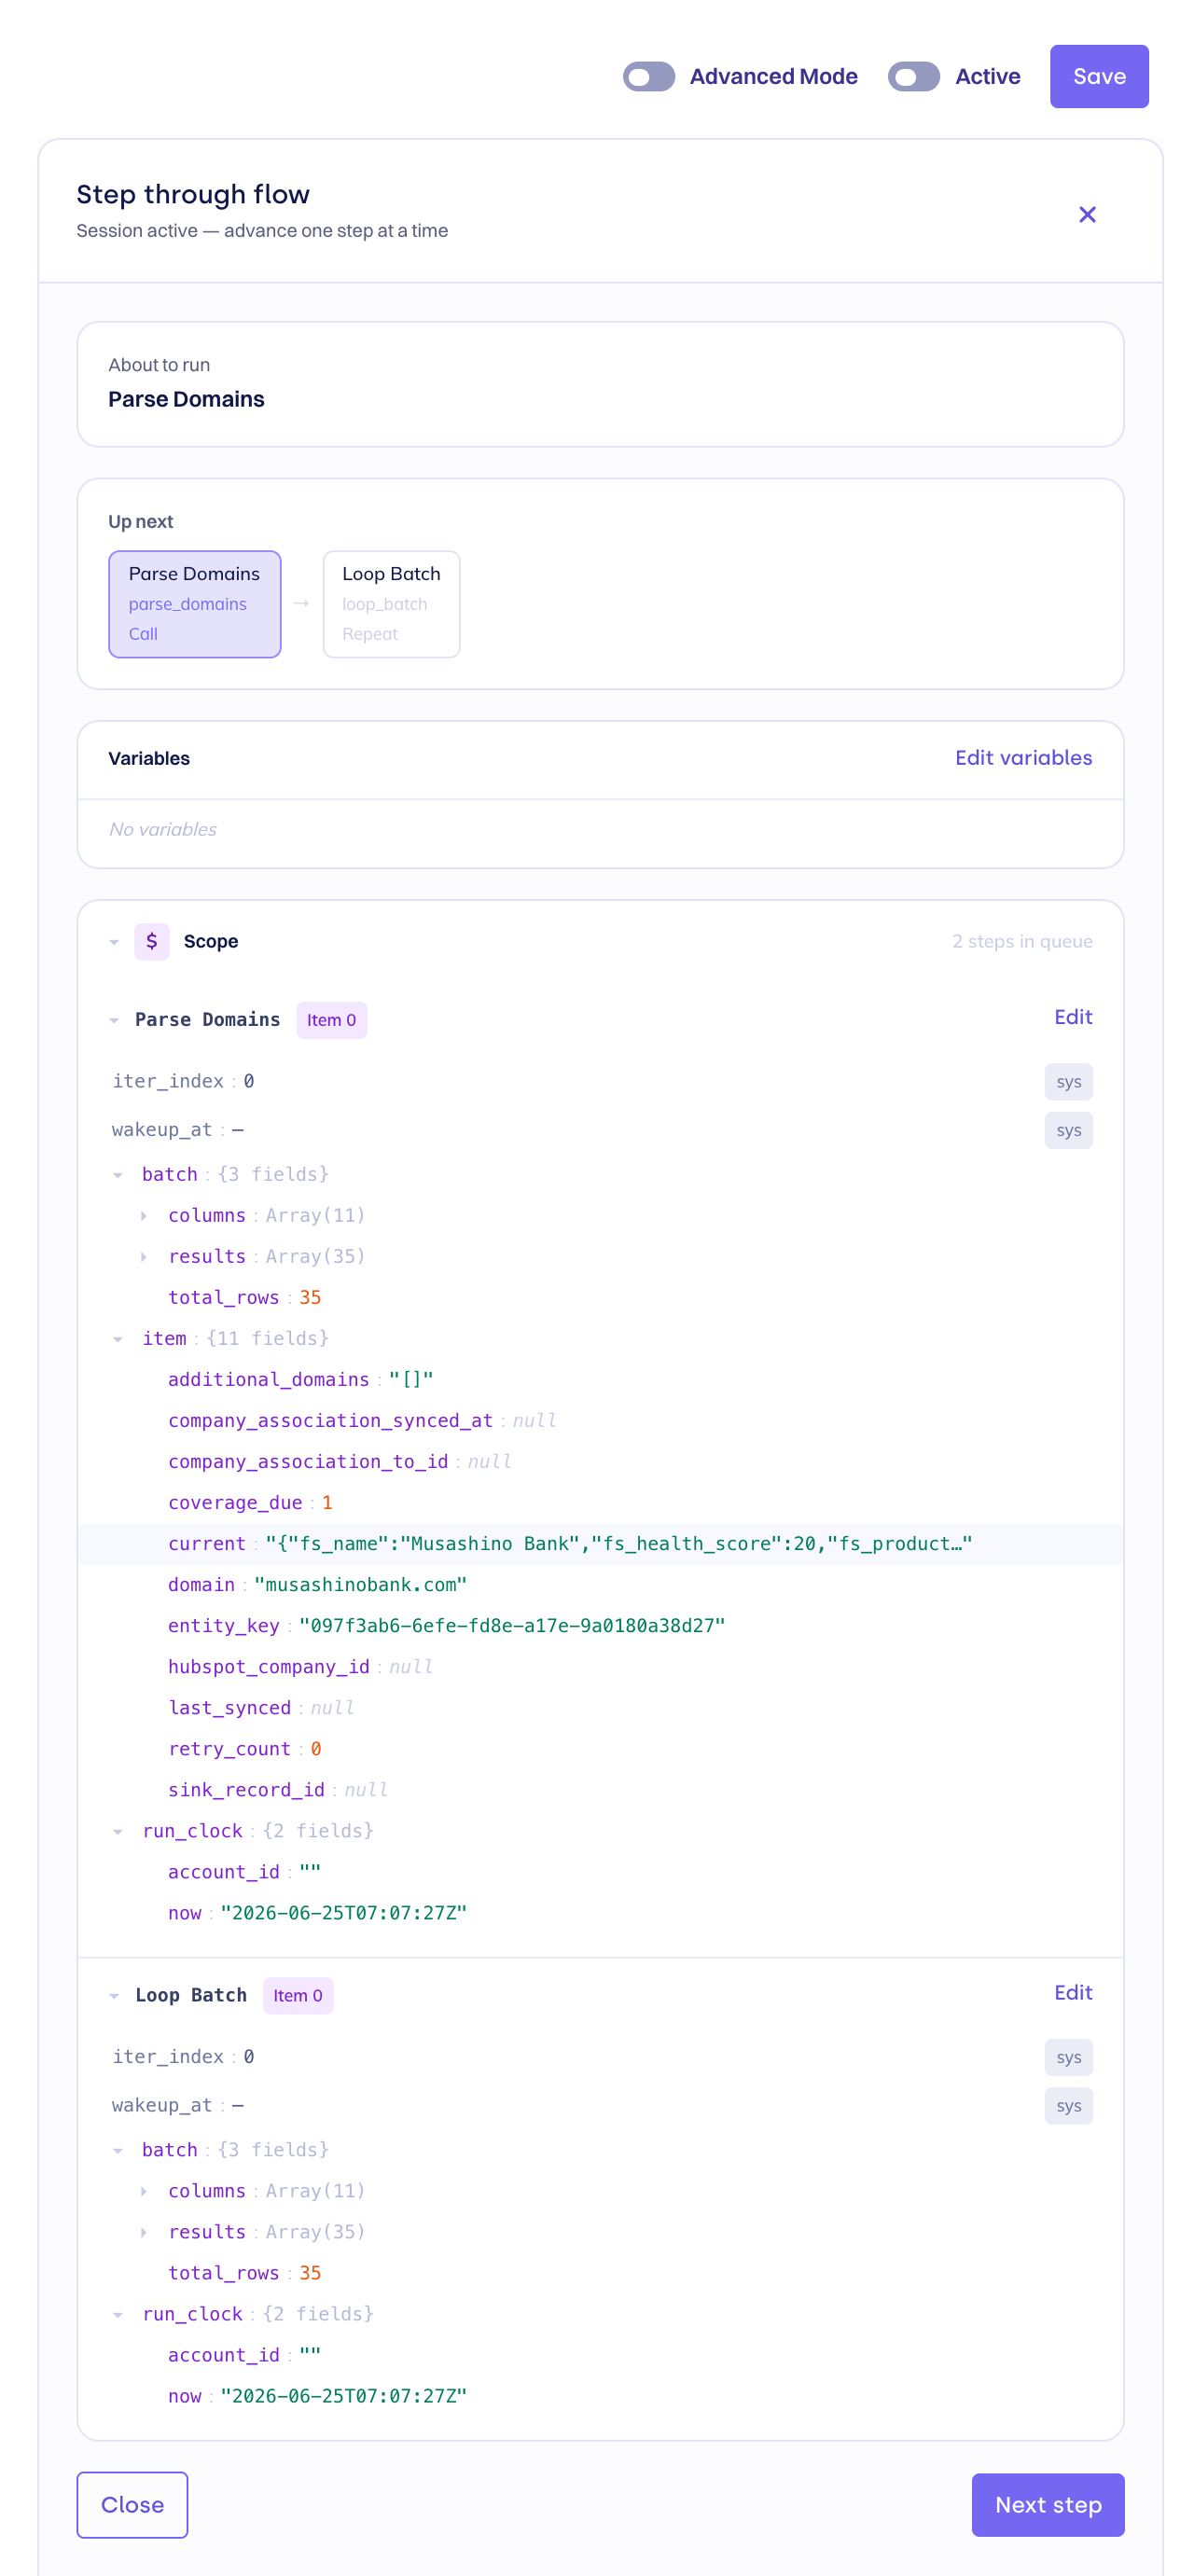
About to run
The card at the top names the current step — the one that will execute when you advance. Its label also reflects the run state:
| State | Meaning |
|---|---|
| About to run | Paused at a step, ready to advance. |
| Ready | Session just started; advance once to enqueue the first step. |
| Waiting for approval | A step requested human approval; advancing approves and continues. |
| Run complete | All paths finished. |
| Run failed | A step errored — the message is shown in the card. |
Up next
A compact chip strip of the upcoming queue. The first chip is the current step (highlighted), and the arrows show the order the runtime will process them. Each chip shows the step's name, its id, and its operation type (Call, Transform, Branch, Condition, Repeat, Wait, Agent, …). Long queues collapse to a +N more chip.
The queue reflects the runtime's breadth-first scheduling, so the visual order may differ from the canvas top-to-bottom layout — especially inside loops. See Operations.
Variables and scope
This is the heart of the debugger. Two sections show you exactly what data exists, split by where it lives:
- Variables (global
@) — flow-wide state under@., visible to every step. The runtime-internalctxkey is hidden. A flow that keeps all its working data in local scope will show No variables here. - Scope (local
$) — the per-step, per-iteration values under$.for each frame in the queue. This is where loops become legible.
Both render as the same explorable tree. Each row shows the key on the left and its value on the right; object and array values are summarized ({3 fields}, Array(35)) and long strings are truncated, so the tree stays readable. Click ▾ / ▸ to expand or collapse nested values.
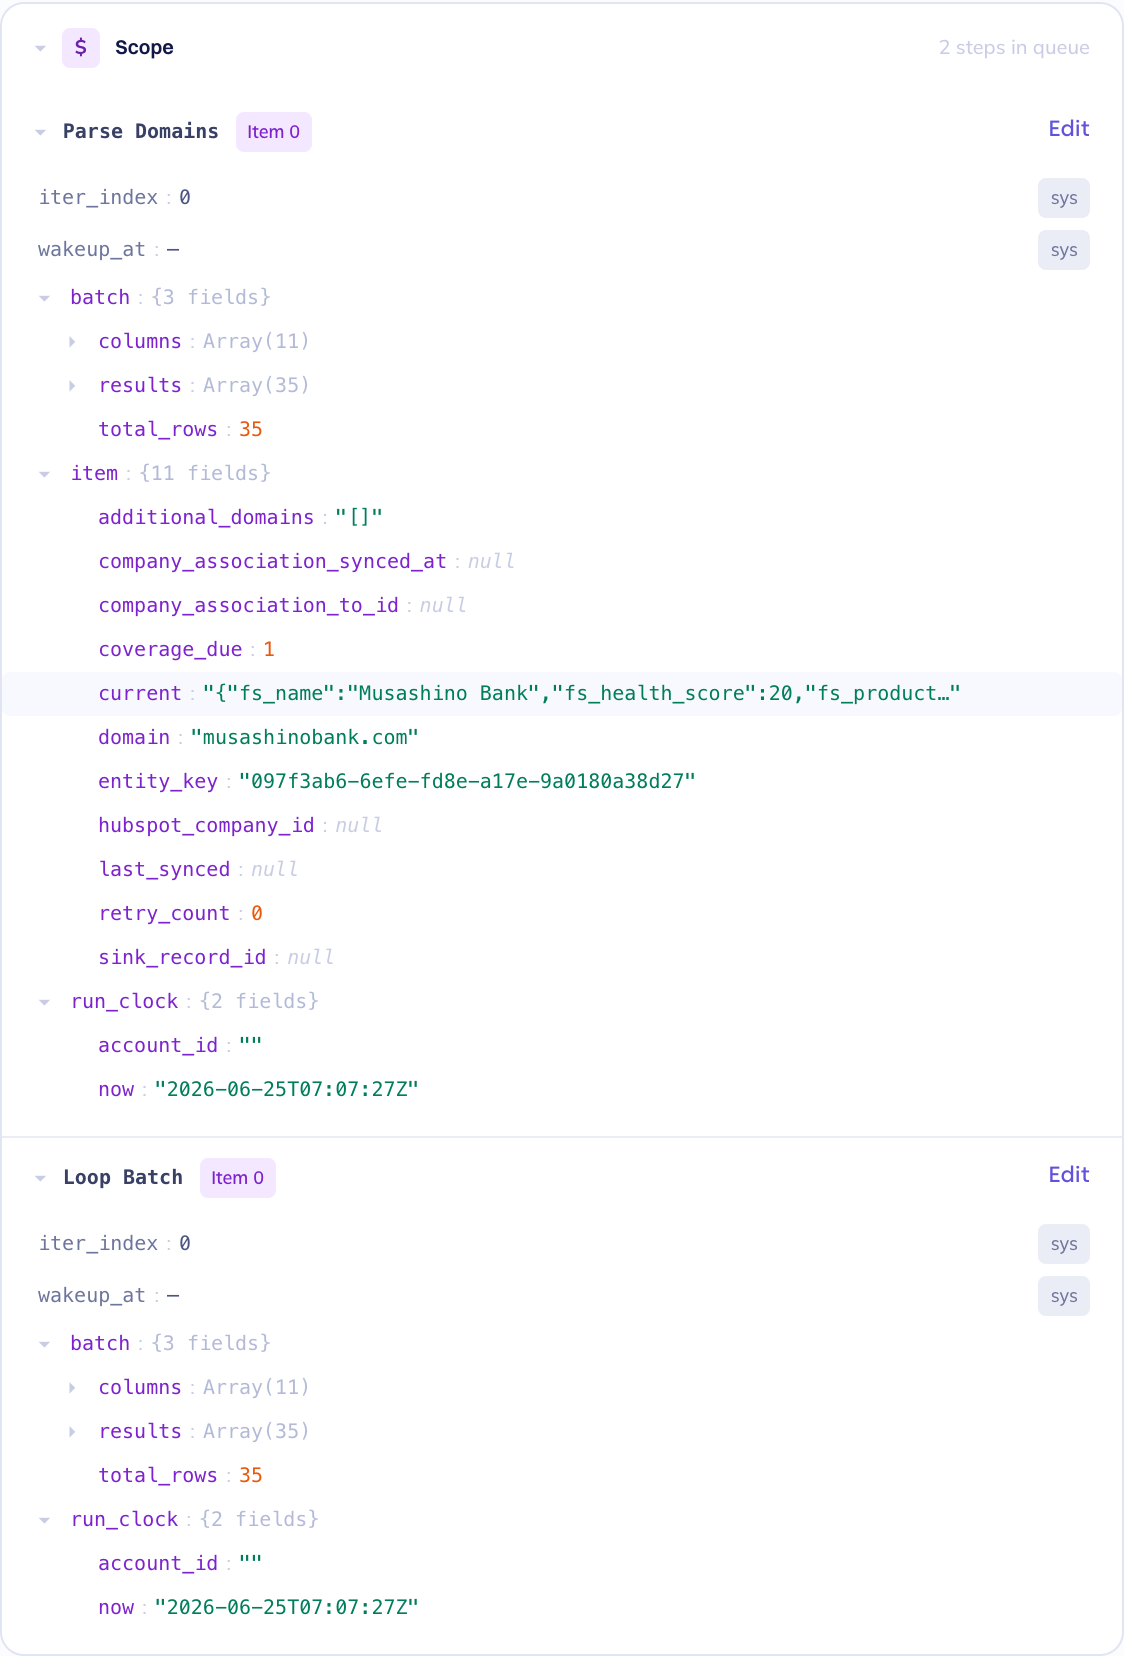
Reading the scope
Each frame in the queue gets its own block, tagged Item N — the loop iteration (iter_index) it belongs to. That's what makes a loop legible: every iteration carries its own local values, and you can see how they differ.
Two runtime-managed fields appear at the top of each frame, marked with a sys tag because they're read-only:
| Field | Meaning |
|---|---|
iter_index | Which loop iteration this frame represents (0-based). |
wakeup_at | For a WAIT step, when the runtime will resume it (— if not waiting). |
Edit values live
You can change variables mid-run to test a hypothesis without re-authoring the flow. The edit applies to the paused run, so the next step sees your edited value.
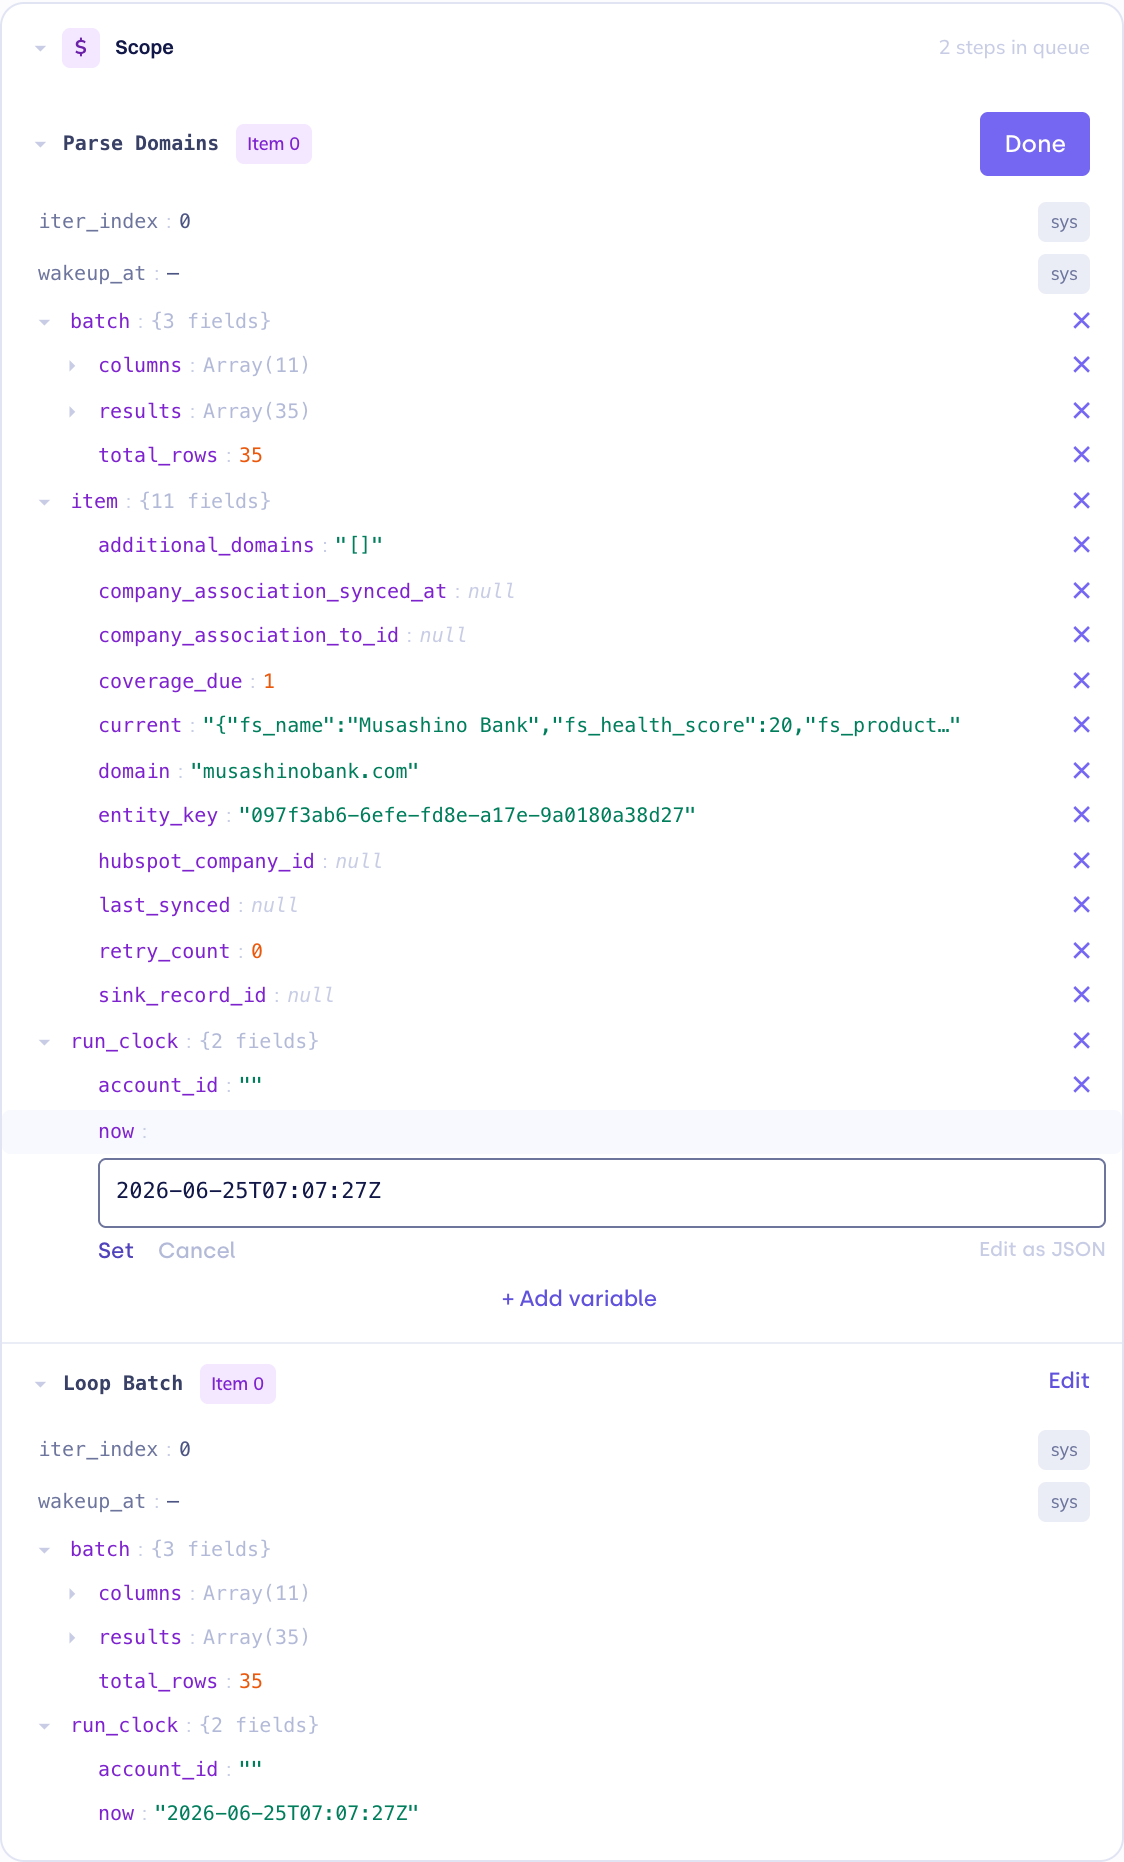
- Click Edit variables on the global section, or Edit on a scope frame.
- Make changes:
- Click any value to edit it inline (Set to keep, Cancel to discard).
- + Add variable adds a new key; the ✕ on a row deletes it.
- Edit as JSON (global section) toggles a raw JSON editor for the whole object — handy for bulk edits or pasting. Invalid JSON is flagged and won't save.
- Click Done to persist. The change is saved to the run before you advance.
The sys rows (iter_index, wakeup_at) are runtime-managed and can't be edited.
Editing is only available while the run is active (paused or waiting for approval). Once a run is complete or failed, variables are read-only.
Advance to the next step
When you've inspected (and optionally edited) the state, advance the run:
- Next step — executes the current step and pauses at the next one. The panel refreshes to show the new current step, updated queue, and new variable/scope values.
- Approve & continue — shown instead when a step is waiting for approval; advancing approves the step and continues.
- Close — exits the debugger. A paused session is kept and can be resumed later from the picker.
Repeat Next step until the run reaches Run complete (or Run failed).
Statuses you'll see
| Status | Meaning |
|---|---|
RUNNING | Paused between steps and ready to advance. |
WAITING_APPROVAL | A step requested approval; use Approve & continue. |
COMPLETED | All paths finished successfully. |
FAILED | A step errored — the message appears in the About to run card. |
Related
- Testing and runs — step tests, trigger previews, and run history
- Variables and data — global
@vs local$scope, and trigger data shapes - Operations — step ops and breadth-first scheduling
- Triggers — simulating trigger payloads