Create an Outcome Agent
An Outcome Agent starts as a draft: you choose what it learns from and which renewals it acts on, then generate cohorts. Creating drafts requires permission to edit workspace configuration.
Create a draft
- Open Outcome Agents from the left sidebar. The Drafts tab opens by default.
- Click New Outcome Agent.
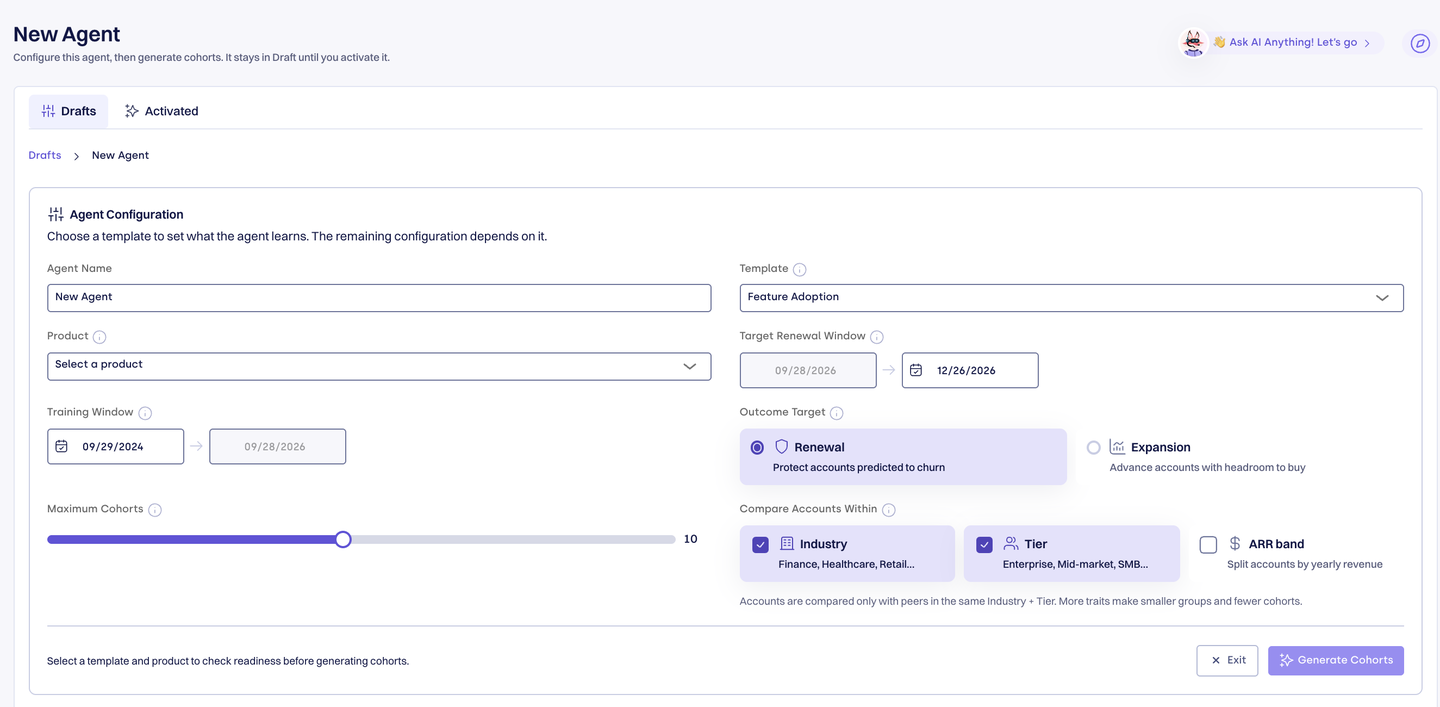
- Fill in the configuration:
| Field | What it does | Default |
|---|---|---|
| Agent Name | A name for the agent. | New Agent |
| Template | Sets what the agent learns. Other fields unlock once a template is chosen. | Feature Adoption |
| Product | The product the cohorts are built from, chosen from your workspace's product catalog. If the catalog is empty, the picker says This workspace has no products yet. and links to Configuration → Products. | — |
| Target Renewal Window | Starts today; you pick the end date. Accounts renewing in this window are the ones the agent acts on. | Next 90 days |
| Training Window | Ends today; you pick the start date. Accounts that came up for renewal in this window teach the agent what good adoption looks like. | Past 730 days |
| Outcome Target | Renewal (protect accounts predicted to churn) or Expansion (advance accounts with headroom to buy). | Renewal |
| Maximum Cohorts | Upper bound on how many cohort pairs the analysis returns, from 1 to 20. | 10 |
| Compare Accounts Within | The traits accounts must share to be compared. See Grouping accounts. | Industry + Tier |
- Click Save Configuration to save the draft, or Generate Cohorts to save it and run the analysis in one step. Generation typically takes a few seconds.
Once a draft is saved, its configuration is read-only. To try different settings, create a new agent.
Grouping accounts
Compare Accounts Within decides which accounts are peers. Accounts are compared only with other accounts that share every selected trait, so an enterprise account's adoption is judged against other enterprise accounts, not against small-business ones.
| Option | Groups accounts by |
|---|---|
| Industry | The account's industry |
| Tier | The account's tier (for example Enterprise, Mid-market, SMB) |
| ARR band | The account's yearly revenue for the product |
Select any combination, or none — with nothing selected, every account is compared with every other account. More traits make smaller groups and fewer cohorts. A trait that most accounts in your workspace don't record is skipped automatically.
When ARR band is selected, an ARR band splits panel lets you choose how revenue is split:
- Split points — type an amount such as
50k,$1.5m, or50,000and press Enter (or comma) to add it. Each split point shows as a chip; click a chip to remove it. - Equal groups — with no split points, accounts are divided into 2 to 5 equal-sized groups (4 by default). Use the − and + buttons to change the count.
The panel previews the resulting bands. With split points of $50k and $250k, the bands read <$50k, $50k–$250k, and ≥$250k. With equal groups, they read Bottom 25%, 25–50%, 50–75%, and Top 25%. The same labels appear on each cohort card.
ARR bands for past renewals use the ARR recorded at the renewal decision, not today's ARR.
Managing drafts
The Drafts list shows each draft's name, Template, Product, Outcome Target, and Cohort Analysis status — either Not generated yet or a View Cohort Analysis link with the date cohorts were last generated. Click a row to open the draft, or click the trash icon to delete it permanently.