Read the Cohort Analysis
Click View Cohort Analysis on a draft to open its cohorts. The header shows how many cohort pairs were returned out of the maximum, how many accounts are in at-risk cohorts, and when the analysis was generated. Pairs are ordered by the revenue they put in play.
To rerun the analysis with fresh data, open the draft and click Regenerate Cohorts. Regenerating replaces the proposed pairs.
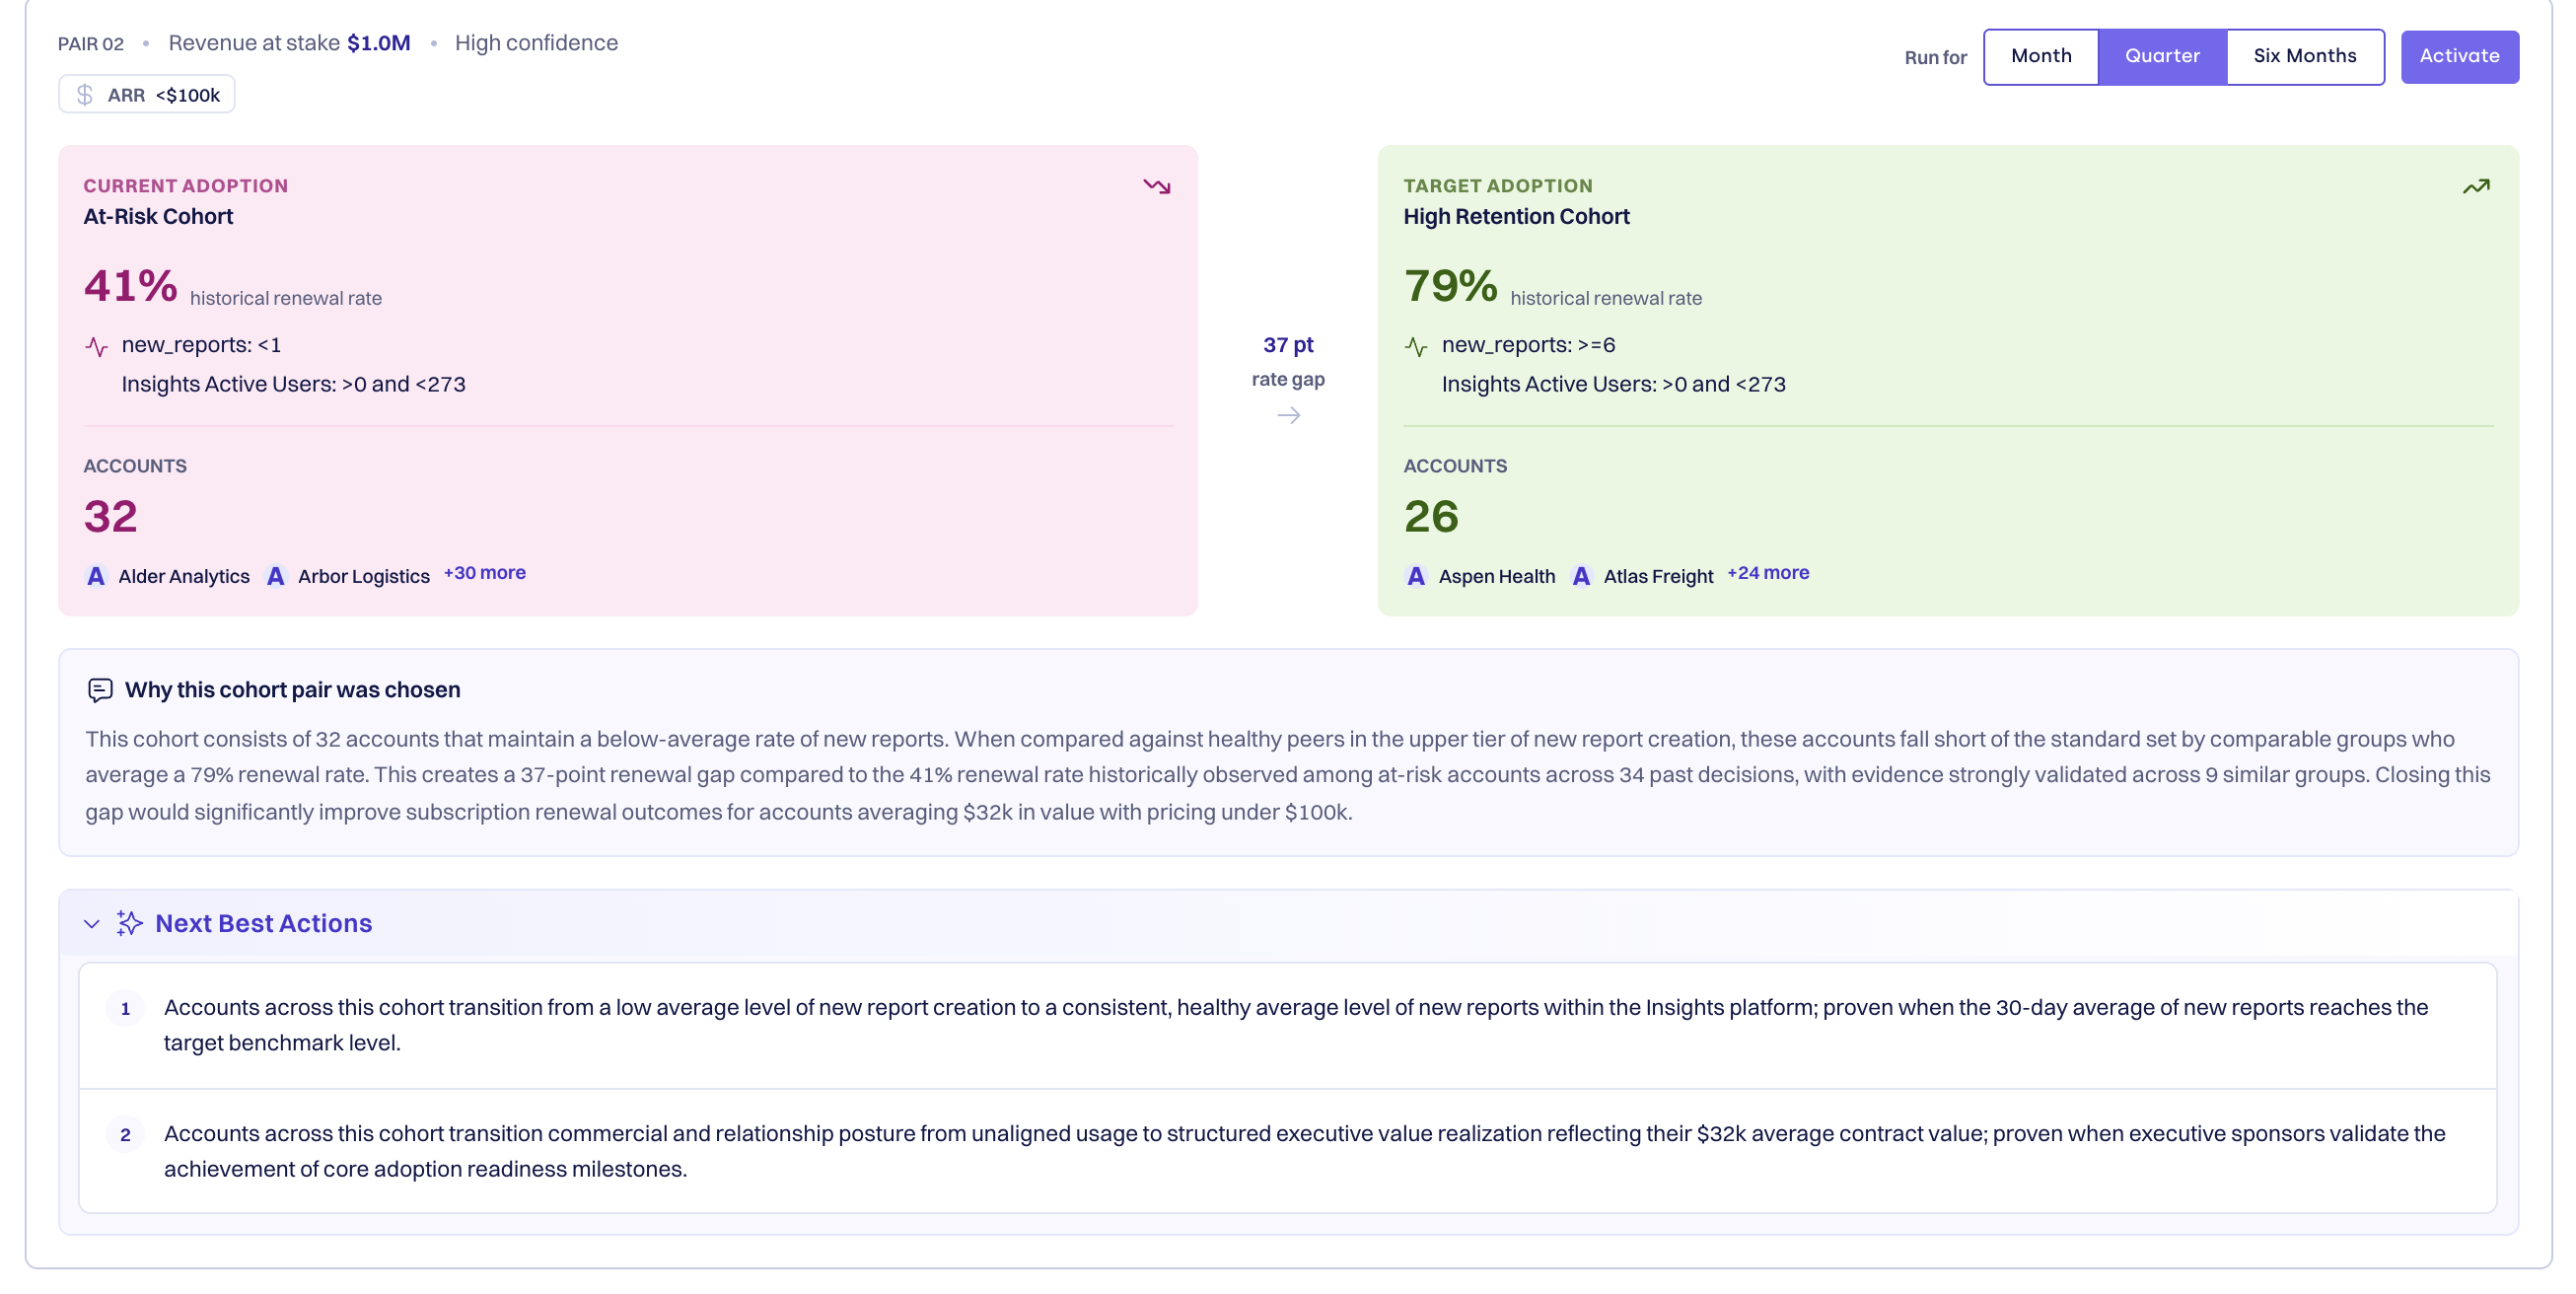
What a cohort pair card shows
| Part | What it tells you |
|---|---|
| PAIR 01, PAIR 02… | The pair's rank. |
| Revenue at stake | The total ARR of the accounts in the at-risk roster today. |
| Confidence | High, Promising, or Low, based on how firmly the historical gap holds up statistically. |
| Trait chips | The peer group this pair was measured in, such as Industry, Tier, or ARR with its band. |
| At-Risk Cohort column | Labeled Current Adoption. The group's historical renewal (or expansion) rate, its adoption level on each signal, and the number of accounts renewing in your target window that match it. |
| rate gap | The difference, in points, between the two historical rates. |
| High Retention Cohort column | Labeled Target Adoption. The same figures for the next adoption level up. |
| Why this cohort pair was chosen | An AI-written explanation of the pair, drawn only from the analysis. |
| Next Best Actions | A collapsible, numbered strategy of two to four steps. See Next best actions. |
Adoption levels read as Signal name: level, and every level states both of its ends — for example >0 and <7 or >=7 and <25. For activity signals, zero stands on its own as 0, because no usage is a different state from light usage.
Under Accounts, each column previews the first two matching accounts. Click +N more to see the rest.
Needle-mover cohort cards
Some agents group accounts by a recurring Needle Mover theme instead of by adoption. Their cards are one-sided:
- The card is numbered COHORT 01 rather than PAIR 01, and shows a single column named after the needle-mover label.
- If the cohort has no historical outcome rate, the column reads Not measured — membership only.
- A Resolved when note explains the exit rule: an account leaves the cohort when its last open issue for that label is fixed or mitigated. Issues closed as not an issue, duplicate, or no longer relevant don't count.
- The explanation is titled Why this cohort was chosen.
- Needle-mover cohorts can't be activated yet, so the card has no Activate control.
Next best actions
Each pair's Next Best Actions is one strategy, not a menu of options: work through every step in order. Each step names the state the whole cohort must reach, and the observable signal that proves an account got there. Steps combine at least two levers — product adoption, relationship, commercial terms, or enablement.
When your workspace has a company profile, the steps are grounded in your actual product offerings and workflows rather than raw metric names. They never cite the statistics behind the pair.